

What “1X2” means
In match analysis, “1X2” stands for the three possible outcomes after normal time: 1 for a home win, X for a draw and 2 for an away win. A forecast gives each outcome a probability, and the three always add up to 100%.
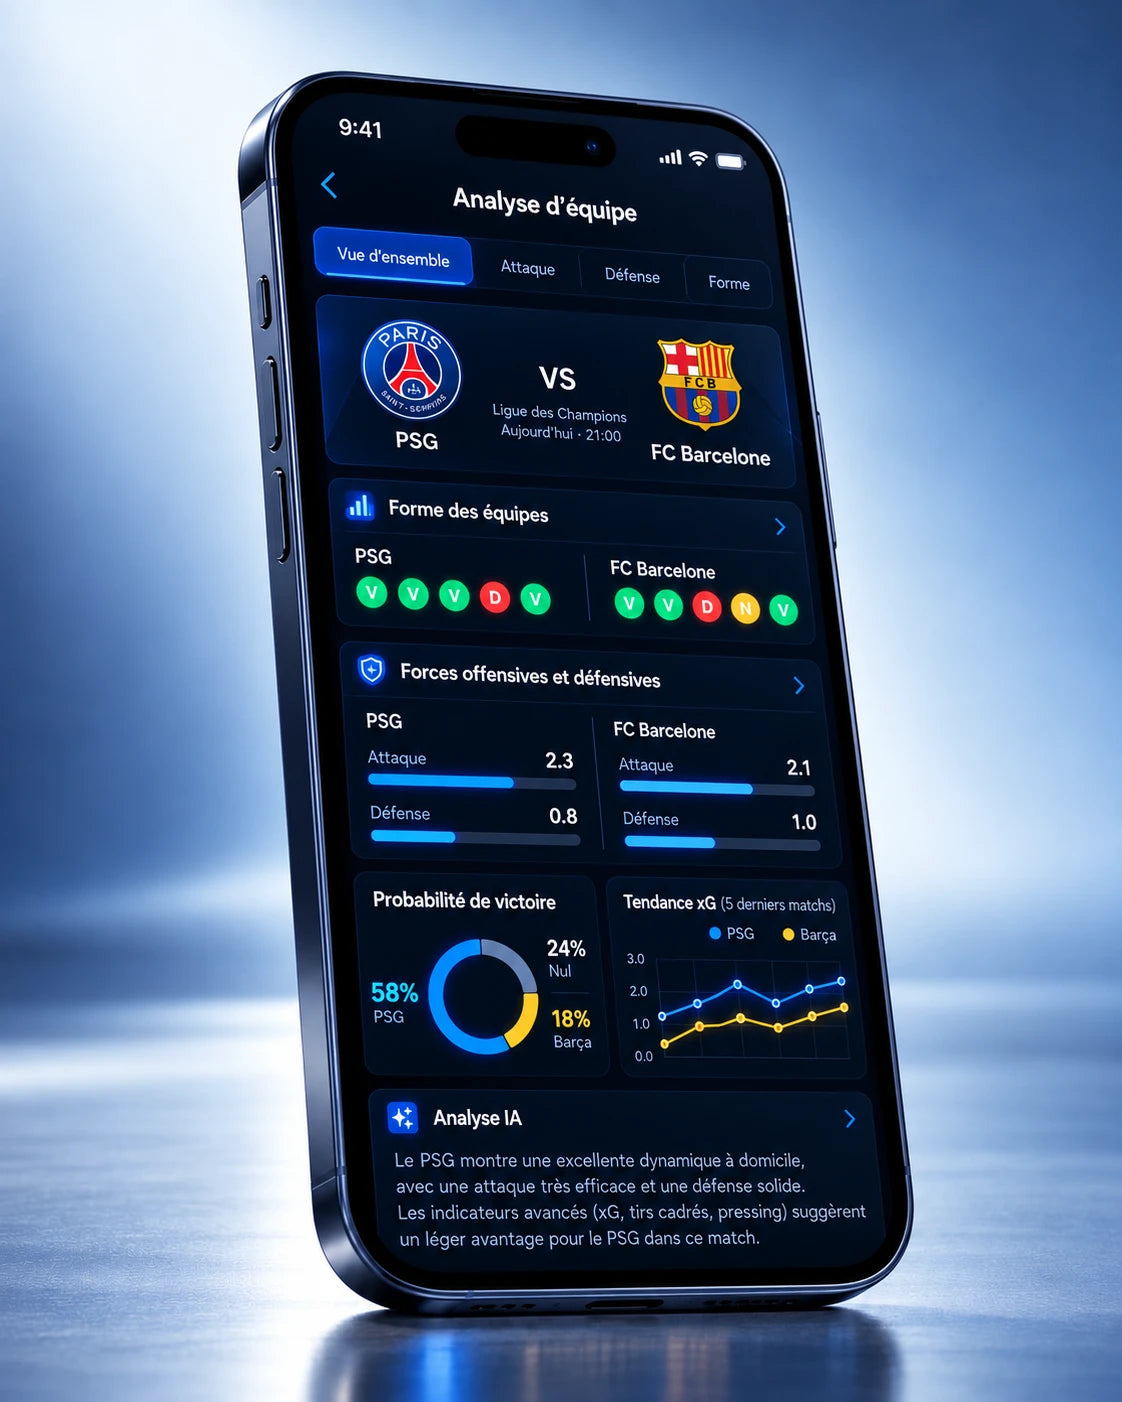
Here is an invented example, for illustration only (teams A and B do not exist):
| Outcome | Estimated probability |
|---|---|
| Team A win (at home) | 52% |
| Draw | 26% |
| Team B win (away) | 22% |
This reads as: team A are favourites, but in roughly one game in two they do not win. A draw or a defeat remains very much on the table (48% combined).
Why 60% is not a certainty
A probability of 60% means that, across many situations judged to be alike, the event would happen about six times in ten. That also means it fails about four times in ten. A few simple checks make the point:
- Two 60% forecasts that both fail in a row? That happens about 16% of the time (0.4 × 0.4).
- Across three matches at 60%, there is roughly a 78% chance that at least one of them does not come off (1 − 0.6 × 0.6 × 0.6).
- A result that goes against a forecast does not prove the forecast was wrong, just as one roll of a die tells you little about the die.
The reverse is also true: a result that matches a forecast does not prove it was good. A forecast is judged over many matches, never one.
The draw: never to be overlooked
Draws are often underrated. A study of 10,785 matches from six seasons of the big five European leagues (England, Spain, Italy, Germany and France) found home teams winning about 38% of matches, drawing about 26% and losing about 36%. The draw rate was almost the same at home and away, so home advantage shows up mainly in the split between wins and defeats. These are past averages: a benchmark, not a forecast for any particular game.
What is a calibrated probability?
A forecast is calibrated when the frequencies actually observed match the probabilities announced. Gather 100 forecasts of “70%”: if about 70 of them come true, the model is well calibrated. If only 60 do, it was too optimistic.
Statisticians check this with a reliability diagram: forecasts are grouped into probability bands and, for each band, the announced probability is compared with the frequency that actually occurred. Measures such as the Brier score summarise the gap between probabilities and outcomes.
Two points matter here:
- Calibration is not the same as accuracy. A forecast that always says “33% / 33% / 33%” can be well calibrated and yet useless, because it never separates a favourite from an underdog.
- It takes a lot of matches. Checking calibration needs hundreds of forecasts compared with their results. Be wary of anyone who claims reliability without showing how it was measured.
How to read a 1X2 forecast, step by step
- Check the total. The three outcomes should add up to 100%.
- Compare with the benchmarks. A home win at 38% is ordinary; at 70% it implies a clear gap in quality.
- Look at the spread, not just the favourite. 40% / 30% / 30% describes a very open game, even if one side is ahead.
- Do not over-read small gaps. 48% against 46% does not point to a winner: the uncertainty in the estimate is much bigger than two points.
- Look for the date and sources. A probability worked out before the team sheets come out may change afterwards. It holds for one moment in time.
What a probability does not tell you
It does not tell you how the game will unfold, who will score, or whether a result is “deserved”. It cannot account for something unpredictable: an early injury, a red card, a refereeing error. It simply sums up the state of the information at a given moment. That is why good analyses also show their assumptions and limits.
About Prediction AI
Prediction AI is an AI-powered predictive sports analysis platform: for a football match it presents estimated probabilities together with the facts behind them and their limits. Take a look at the Prediction AI plans. An estimate is an estimate, never a certainty.
Further reading
- Expected Goals (xG), Over/Under 2.5 Goals and Both Teams to Score: Understanding the Indicators
- The Factors That Influence a Football Match and How to Weigh Them Cautiously
- The Prediction AI Method: How a Match Analysis Is Produced, in Full Transparency